


测绘学报 ›› 2025, Vol. 54 ›› Issue (3): 473-480.doi: 10.11947/j.AGCS.2025.20230443
蔡艳辉1( ), 程鹏飞2, 张莉1
收稿日期:2023-09-29
出版日期:2025-04-11
发布日期:2025-04-11
作者简介:蔡艳辉(1973—),男,博士,研究员,研究方向为卫星导航高精度定位技术、测绘产品质量检验理论与方法、地理信息安全量化评估方法等。 E-mail:caiyh@casm.ac.cn
基金资助:
Yanhui CAI1(), Pengfei CHENG2, Li ZHANG1
Received:2023-09-29
Online:2025-04-11
Published:2025-04-11
About author:CAI Yanhui (1973—), male, PhD, researcher, majors in precise positioning of GNSS, theory and technology of quality inspection of surveying and mapping products, evaluation of geo-information data security. E-mail: caiyh@casm.ac.cn
Supported by:摘要:
本文基于累计超几何分布的接受概率理论分析了抽样方案系列一致性问题的本质,提出了抽样检验的检验功效概念,基于接受概率与批量对数函数定义了检验功效指数(ICI)函数,实现了抽样方案评价的量化计算。结合测绘成果质检应用,在OC曲线分析的基础上,提出了检验功效特性(ICC)曲线的分析方法。7个典型测绘质检抽样方案计算结果表明ICI能够较好地反映各个抽样方案的综合特性;ICC曲线分析表明7个典型测绘质检抽样方案的一致性先验AQL区间适用范围为0.3%~1%,最佳AQL为0.6%。本文的结论一方面从抽样检验功效的角度给出了测绘地理信息成果的先验质量水平的要求,另一方面对智能化测绘生产和众源测绘成果的可靠性分析和应用具有重要指导意义。
中图分类号:
蔡艳辉, 程鹏飞, 张莉. 测绘成果质量抽样检测功效量化指标[J]. 测绘学报, 2025, 54(3): 473-480.
Yanhui CAI, Pengfei CHENG, Li ZHANG. Inspection capacity index (ICI)—a sampling scheme measure of quality inspection of surveying and mapping products[J]. Acta Geodaetica et Cartographica Sinica, 2025, 54(3): 473-480.
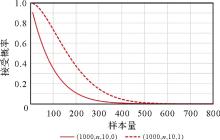
图1
接受概率与样本量的关系曲线"
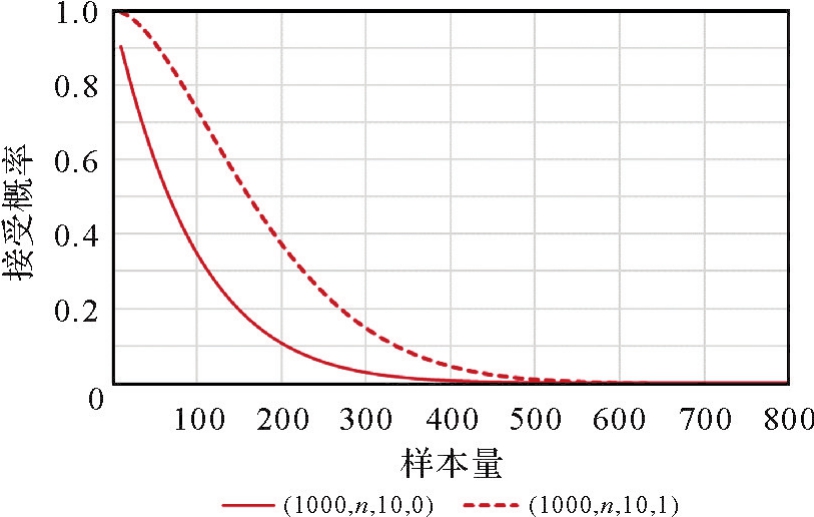
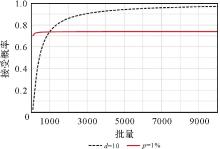
图2
接受概率与批量的关系曲线"
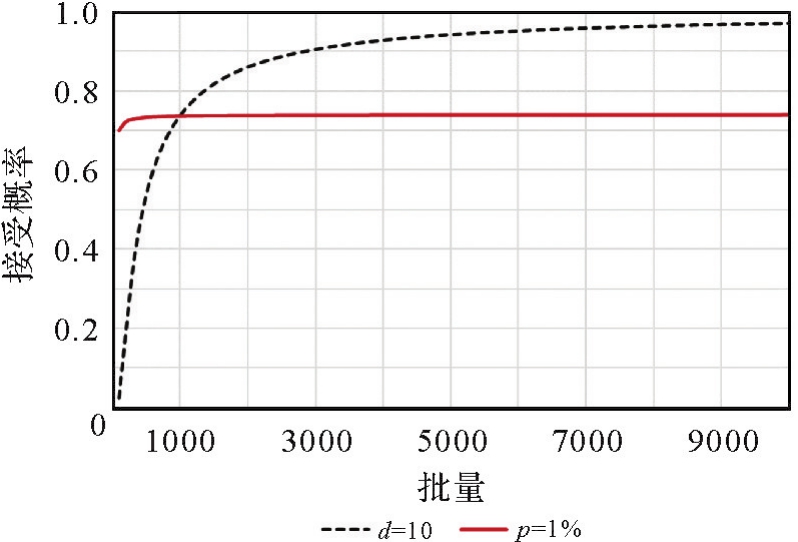
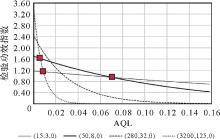
图3
典型抽样方案的ICC曲线"
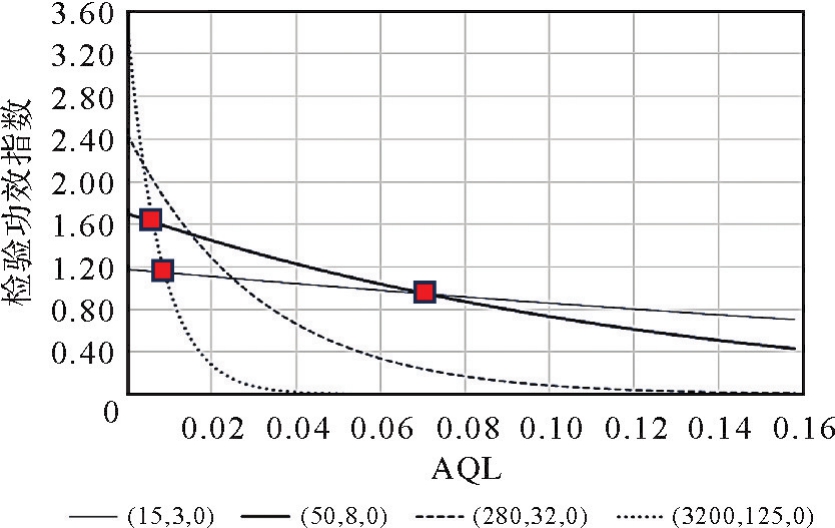
表1
测绘成果抽样检验"
| 序号 | 批量 | 样本量 | 序号 | 批量 | 样本量 |
|---|---|---|---|---|---|
| 1 | 20 | 3 | 9 | 180 | 14 |
| 2 | 40 | 5 | 10 | 200 | 15 |
| 3 | 60 | 7 | 11 | 232 | 17 |
| 4 | 80 | 9 | 12 | 283 | 20 |
| 5 | 100 | 10 | 13 | 362 | 24 |
| 6 | 120 | 11 | 14 | 487 | 30 |
| 7 | 140 | 12 | 15 | 686 | 40 |
| 8 | 160 | 13 | 16 | 1000 | 56 |
| 批量>1000,分批次提交,批次数最小,各批次应均匀。 | |||||
表2
7个典型抽样方案接受概率"
| 批量 | 样本量 | 接受质量限AQL | ||||
|---|---|---|---|---|---|---|
| 0.10% | 0.30% | 0.50% | 1.00% | 2.00% | ||
| 200 | 15 | 0.985 1 | 0.955 9 | 0.927 6 | 0.860 1 | 0.738 6 |
| 232 | 17 | 0.983 1 | 0.950 2 | 0.918 3 | 0.842 9 | 0.709 3 |
| 283 | 20 | 0.980 2 | 0.941 7 | 0.904 6 | 0.817 9 | 0.667 6 |
| 362 | 24 | 0.976 3 | 0.930 4 | 0.886 7 | 0.785 7 | 0.615 8 |
| 487 | 30 | 0.970 4 | 0.913 8 | 0.860 4 | 0.739 7 | 0.545 5 |
| 686 | 40 | 0.960 8 | 0.886 8 | 0.818 3 | 0.669 0 | 0.445 7 |
| 1000 | 56 | 0.945 5 | 0.845 1 | 0.755 3 | 0.569 6 | 0.322 6 |
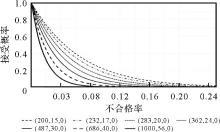
图4
7个典型抽样方案的OC曲线"
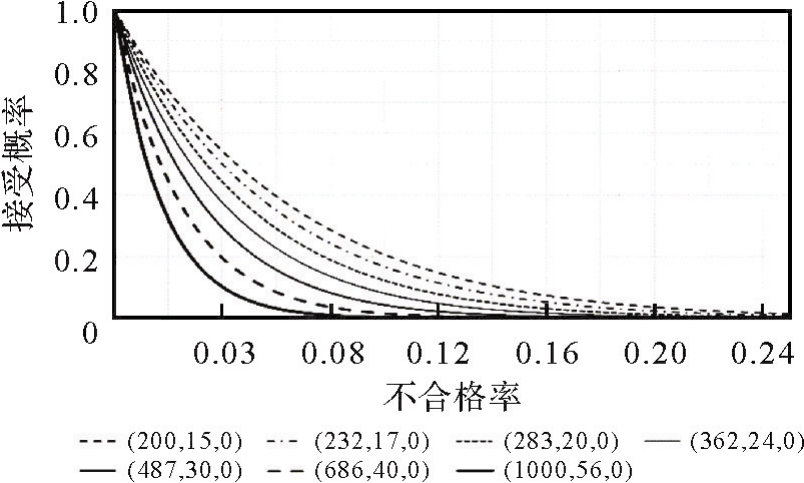
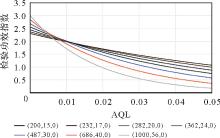
图5
7个典型抽样方案的ICC曲线"
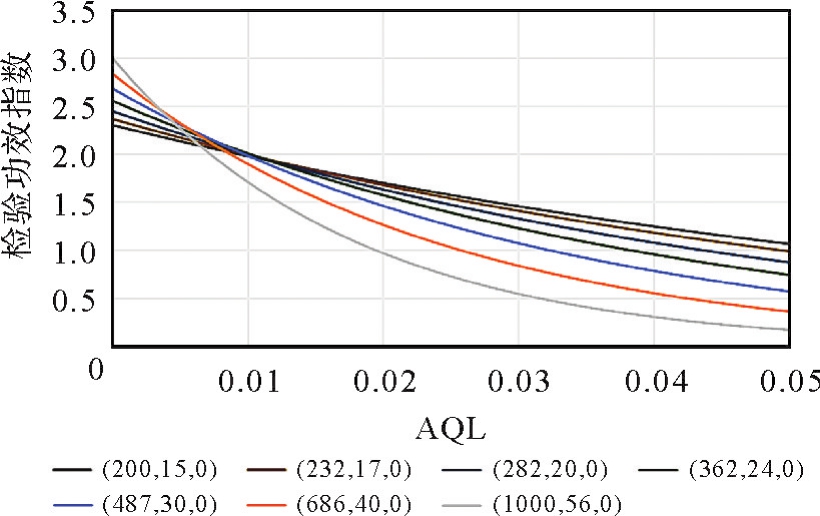
表3
7个典型抽样方案ICI"
| 批量 | 样本量 | 接受质量限AQL | |||||||
|---|---|---|---|---|---|---|---|---|---|
| 0.10% | 0.30% | 0.50% | 1.00% | ||||||
| L(p) | ICI | L(p) | ICI | L(p) | ICI | L(p) | ICI | ||
| 200 | 15 | 0.985 | 2.267 | 0.956 | 2.200 | 0.928 | 2.134 | 0.860 | 1.979 |
| 232 | 17 | 0.983 | 2.326 | 0.950 | 2.248 | 0.918 | 2.172 | 0.843 | 1.994 |
| 283 | 20 | 0.980 | 2.403 | 0.942 | 2.309 | 0.905 | 2.218 | 0.818 | 2.005 |
| 362 | 24 | 0.976 | 2.498 | 0.930 | 2.381 | 0.887 | 2.269 | 0.786 | 2.010 |
| 487 | 30 | 0.970 | 2.608 | 0.914 | 2.456 | 0.860 | 2.312 | 0.740 | 1.988 |
| 686 | 40 | 0.961 | 2.725 | 0.887 | 2.515 | 0.818 | 2.321 | 0.669 | 1.897 |
| 1000 | 56 | 0.946 | 2.837 | 0.845 | 2.535 | 0.755 | 2.266 | 0.570 | 1.709 |
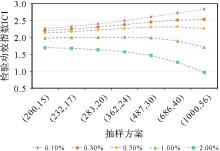
图6
7个典型抽样方案的检验功效指数序列"
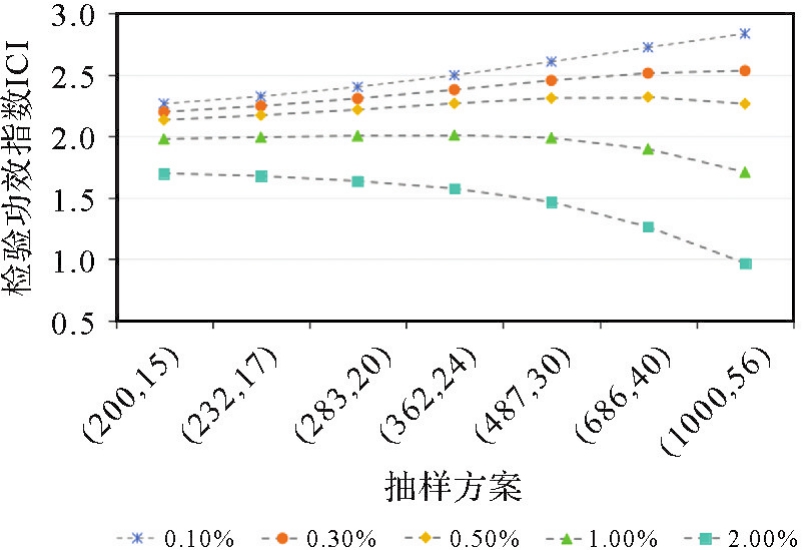
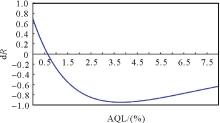
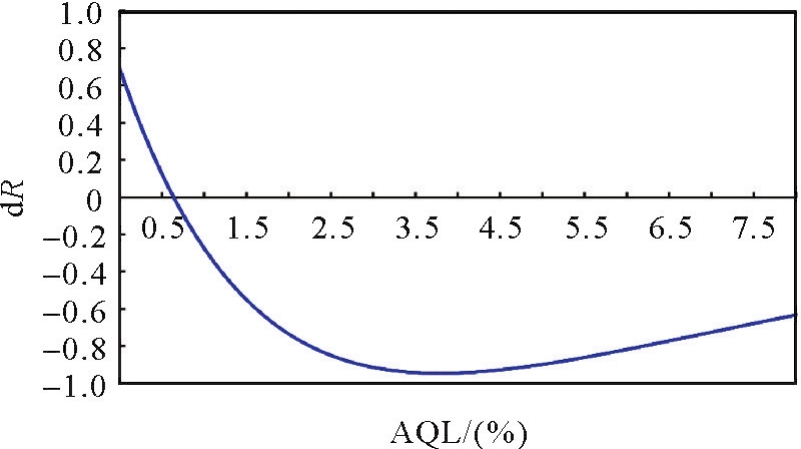
图7
检验功效指数差值的变化曲线"
| [1] |
陈军, 刘万增, 武昊, 等. 智能化测绘的基本问题与发展方向[J]. 测绘学报, 2021, 50(8): 995-1005. DOI:.
doi: 10.11947/j.AGCS.2021.20210235 |
|
CHEN Jun, LIU Wanzeng, WU Hao, et al. Smart surveying and mapping: fundamental issues and research agenda[J]. Acta Geodaetica et Cartographica Sinica, 2021, 50(8): 995-1005.DOI:.
doi: 10.11947/j.AGCS.2021.20210235 |
|
| [2] | 盛骤, 谢世千, 潘承毅. 概率论与数理统计[M]. 3版. 北京: 高等教育出版社, 2001. |
| SHENG Zhou, XIE Shiqian, PAN Chengyi. Probability and mathematical statistics[M]. 3rd ed. Beijing: Higher Education Press, 2001. | |
| [3] | 信海红. 抽样检验技术[M]. 北京: 中国计量出版社, 2013. |
| XIN Haihong. Technology of sampling inspection[M]. Beijing: Metrological Publishing House of China, 2013. | |
| [4] | 张璇, 赵静, 丁文兴. 大数据背景下产品质量抽样调查的样本量设计[J]. 系统科学与数学, 2022, 42(1): 133-140. |
| ZHANG Xuan, ZHAO Jing, DING Wenxing. Sample size design of product quality sampling survey under the background of big data[J]. Journal of System Science and Mathematics Science, 2022, 42(1): 133-140. | |
| [5] | 王敏华. 大批量计数抽样方案的制定[J]. 浙江工程学院学报, 1999, 16(2): 123-127. |
| WANG Minhua. Determination of single sampling plan for large lots[J]. Journal of Zhejiang Institute of Science and Technology, 1999, 16(2): 123-127. | |
| [6] | 姜成晟, 王劲峰, 曹志冬. 地理空间抽样理论研究综述[J]. 地理学报, 2009, 64(3): 368-380. |
| JIANG Chengsheng, WANG Jinfeng, CAO Zhidong. A review of geo-spatial sampling theory[J]. Acta Geographica Sinica, 2009, 64(3): 368-380. | |
| [7] | 李根成. 空空导弹环境例行试验批量及抽样研究[J]. 航空兵器, 2018(5): 85-88. |
| LI Gencheng. Research on batches and samples for air-to-air missiles environmental routine test[J]. Aero Weaponry, 2018(5): 85-88. | |
| [8] | 史文中. 地理信息系统中几何特征不确定性的通用模型:从1维到N维[J]. 测绘学报, 1997, 26(2): 68-75. |
| SHI Wenzhong. A generic statistical approach for handling uncertainties of geometric features in GIS from 1 to N dimensions[J]. Acta Geodaetica et Cartographica Sinica, 1997, 26(2): 68-75. | |
| [9] | 史文中, 童小华, 刘大杰. GIS中一般曲线的不确定性模型[J]. 测绘学报, 2000, 29(1): 52-58. |
| SHI Wenzhong, TONG Xiaohua, LIU Dajie. An approach for modeling error of generic curve features in GIS[J]. Acta Geodaetica et Cartographic Sinica, 2000, 29(1): 52-58. | |
| [10] | 王金铃, 陈永奇. 论观测的可靠性度量[J]. 测绘学报, 1994, 23(4): 252-258. |
| WANG Jinling, CHEN Yongqi. Some remarks on the reliability measures[J]. Acta Geodaetica et Cartographica Sinica, 1994, 23(4): 252-258. | |
| [11] | 王宏涛, 王汉斌, 陈晓怀, 等. 测量不确定度引起的批量产品检验误判风险评估[J]. 计量学报, 2017, 38(5): 559-562. |
| WANG Hongtao, WANG Hanbin, CHEN Xiaohuai, et al. Evaluation of misjudgment risks caused by measurement uncertainty for batch product inspection[J]. Acta Metrologica Sinica, 2017, 38(5): 559-562. | |
| [12] |
蔡艳辉, 程鹏飞, 张莉, 等. 测绘地理信息产品抽样检验的两类错误概率[J]. 测绘学报, 2019, 48(8): 954-959. DOI:.
doi: 10.11947/j.AGCS.2019.20180108 |
|
CAI Yanhui, CHENG Pengfei, ZHANG Li, et al. Probabilities of two types of errors in sampling inspection for surveying and mapping productis[J]. Acta Geodaetica et Cartographica Sinica, 2019, 48(8): 954-959. DOI:.
doi: 10.11947/jAGCS.2019.20180108 |
|
| [13] | 中华人民共和国国家市场监督管理总局, 中国国家标准化管理委员会. 测绘成果质量检查与验收:GB/T 24356—2023[S]. 北京: 中国标准出版社, 2023. |
| State Administration for Market Regulation of the People's Republic of China, National Standardization Administration of China. Specifications for quality inspection and acceptance of surveying and mapping products: GB/T 24356—2023[S]. Beijing: Standards Press of China, 2023. | |
| [14] | 曾衍伟, 谭明建. 国家标准《测绘成果质量检查与验收》的编制与应用[J]. 测绘标准化, 2010, 26(3): 1-4. |
| ZENG Yanwei, TAN Mingjian. Development and application of national standard specifications for quality inspection and acceptance of surveying and mapping products[J]. Standardization of Surveying and Mapping, 2010, 26(3): 1-4. | |
| [15] | DODGE H F, ROMING H G. Sampling inspection table[M]. New York: John Wiley & Son, 1959. |
| [16] | KENDALL M G. Sampling inspection tables regression analysis of production costs and factory operations[J]. Nature, 1945, 155(3937): 438-439. |
| [17] | Missiles, guided, design and construction, general specification for MIL-M-8555C[EB/OL]. [2023-06-07]. http://guidedmissilescomplete.emilspec.com/MIL-M-8555/index.html. |
| [18] | 中华人民共和国国家质量监督检验检疫总局, 中国国家标准化管理委员会. 计数抽样检验程序 第1部分:用于逐批检验按可接受质量界限(AQL)检索的抽样计划:GB/T 2828.1—2012[S]. 北京: 中国标准出版社, 2012. |
| General Administration of Quality Supervision, Inspection and Quarantine of the People's Republic of China, China National Standardization Management Committee. Sampling procedures for inspection by attributes Part 1: sampling schemes indexed by acceptance quality limit (AQL) for lot-by-lot inspection: GB/T 2828.1—2012[S]. Beijing: Standards Press of China, 2012. | |
| [19] | 蔡艳辉, 程鹏飞, 张莉, 等. 一种测绘地理信息质检抽样方案评价方法[J]. 武汉大学学报(信息科学版), 2023, 48(5): 816-820. |
| CAI Yanhui, CHENG Pengfei, ZHANG Li, et al. A method to evaluate sampling schemes adopted in surveying and mapping products' inspection[J]. Geomatics and Information Science of Wuhan University, 2023, 48(5): 816-820. | |
| [20] | 张维铭, 杨师鸿. 计数抽样方案评论[J]. 浙江丝绸工学院学报, 1959, 2(2): 56-61. |
| ZHANG Weiming, YANG Shihong. Comments on attribute sampling scheme[J]. Journal of Zhejiang Institute of Silk Textiles, 1959, 2(2): 56-61. | |
| [21] | 丁善婷, 胡志坤. 零接收限抽样方案的应用研究[J]. 湖北工业大学学报, 2008, 23(1): 70-72. |
| DING Shanting, HU Zhikun. Applied study of accept-on-zero sampling plan[J]. Journal of Hubei University of Technology, 2008, 23(1): 70-72. | |
| [22] | 刘芳宇. 质量三等级产品计数抽样理论与方法研究[D]. 北京: 北京理工大学, 2015. |
| LIU Fangyu. The study on attributes sampling theory and methods for three-class products[D]. Beijing: Beijing Institute of Technology, 2015. | |
| [23] | 蔡艳辉, 程鹏飞, 张莉. 一种现代大地测量成果质量检验的新思路[J]. 测绘科学, 2020, 45(3): 1-7. |
| CAI Yanhui, CHENG Pengfei, ZHANG Li. A new quality model for modern geodetic surveying achievements inspection[J]. Science of Surveying and Mapping, 2020, 45(3): 1-7. | |
| [24] | 刘大杰, 刘春. GIS数字产品质量抽样检验方案探讨[J]. 武汉测绘科技大学学报, 2000, 25(4): 348-352. |
| LIU Dajie, LIU Chun. Study on sampling inspection schemes to digital products in GIS[J]. Journal of Wuhan Technical University of Surveying and Mapping, 2000, 25(4): 348-352. | |
| [25] | 刘春, 刘大杰, 史文中. GIS数字地图质量子幅抽样方案的探讨[J]. 测绘学报, 2002, 31(S1): 99-102. |
| LIU Chun, LIU Dajie, SHI Wenzhong. Study of quality sampling inspection with seed-map to digital products in GIS[J]. Acta Geodaetica et Cartographica Sinica, 2002, 31(S1): 99-102. | |
| [26] | 王振华, 童小华, 梁丹, 等. 连续大批量空间数据质量抽样检验方案[J]. 同济大学学报(自然科学版), 2010, 38(5): 749-752. |
| WANG Zhenhua, TONG Xiaohua, LIANG Dan, et al. Sampling inspection schemes for continuous lot spatial data[J]. Journal of Tongji University (Natural Science), 2010, 38(5): 749-752. | |
| [27] | CAI Yanhui, ZHANG Li, MA Xu. Using WGM2012 to compute gravity anomaly corrections of leveling observations in China[J]. Journal of Geodesy and Geoinformation Science, 2023, 6(1): 88-94. |
| [28] |
史文中, 陈鹏飞, 张效康. 地理国情监测可靠性分析[J]. 测绘学报, 2017, 46(10): 1620-1626. DOI:.
doi: 10.11947/j.AGCS.2017.20170377 |
|
SHI Wenzhong, CHEN Pengfei, ZHANG Xiaokang. Reliability analysis in geographical conditions mornitoring[J]. Acta Geodaetica et Cartographica Sinica, 2017, 46(10): 1620-1626. DOI:.
doi: 10.11947/j.AGCS.2017.20170377 |
| [1] | 吴可夫, 付海强, 朱建军, 韩启金, 王爱春, 张明霞, 李志伟. 顾及森林区穿透深度影响的LT-1 InSAR区域网平差[J]. 测绘学报, 2025, 54(6): 1009-1020. |
| [2] | 李新娜, 韩松辉, 陈轲, 郭杰. 一种基于Rayleigh商的复共线性的诊断指标[J]. 测绘学报, 2025, 54(3): 422-431. |
| [3] | 胡川, 史宗浩, 任大钦. 通用非线性高斯-赫尔默特模型参数估计的同伦方法[J]. 测绘学报, 2024, 53(11): 2178-2188. |
| [4] | 闫广峰, 岑敏仪. L1范数探测粗差失效的观测量识别方法[J]. 测绘学报, 2019, 48(11): 1430-1438. |
| [5] | 刘志平, 朱丹彤, 余航, 张克非. 等价条件平差模型的方差-协方差分量最小二乘估计方法[J]. 测绘学报, 2019, 48(9): 1088-1095. |
| [6] | 蔡艳辉, 程鹏飞, 张莉, 徐彦田. 测绘地理信息产品抽样检验的两类错误概率[J]. 测绘学报, 2019, 48(8): 954-959. |
| [7] | 邓兴升, 彭思淳, 游扬声. 加权整体最小二乘EIO模型与算法[J]. 测绘学报, 2019, 48(7): 926-930. |
| [8] | 王乐洋, 余航, 邹传义, 鲁铁定. 加权整体最小二乘EIV模型与算法——与“加权整体最小二乘EIO模型与算法”一文的讨论[J]. 测绘学报, 2019, 48(7): 931-937. |
| [9] | 宋迎春, 夏玉国, 谢雪梅. 基于椭球不确定性的平差模型与算法[J]. 测绘学报, 2019, 48(5): 555-562. |
| [10] | 王乐洋, 温贵森. 偏差改正的Partial EIV模型方差分量估计[J]. 测绘学报, 2019, 48(4): 412-421. |
| [11] | 李建章, 闫浩文. 参数法CPⅢ精密三角高程控制网数据处理方法[J]. 测绘学报, 2019, 48(4): 431-438. |
| [12] | 李博峰, 章浙涛. 时间相关观测的几种动态数据处理方法[J]. 测绘学报, 2018, 47(12): 1563-1570. |
| [13] | 方兴, 黄李雄, 曾文宪, 吴云. 稳健估计的一种改进迭代算法[J]. 测绘学报, 2018, 47(10): 1301-1306. |
| [14] | 王志忠, 宋迎春, 何玲莉. 系数矩阵中部分有界不确定性的混合平差算法[J]. 测绘学报, 2018, 47(9): 1171-1178. |
| [15] | 谢雪梅, 宋迎春, 肖兆兵. 参数带有区间约束的平差模型迭代算法[J]. 测绘学报, 2018, 47(8): 1141-1147. |
| 阅读次数 | ||||||
|
全文 |
|
|||||
|
摘要 |
|
|||||